Time-browse Earth with Terrascope

The amazing geodata portal at King’s College London, unveiled early last week, has just gotten better. First, the site’s layout has been overhauled, and a lot of the layers have been written up.

Second, a new database has been added, “the largest of all,” writes Mark Mulligan. It’s Terrascope, a planet-wide collection of superoverlays of satellite imagery from the 1970s, 1990 and 2000, so that you now really can time-browse the Earth, checking out urbanization, deforestation and other large-scale changes to the Earth’s surface over time. Here’s how Mark describes it:

Terrascope brings some history to Google Earth. Google Earth imagery is largely made up of the NASA Circa 2000 LANDSAT Mosaic (processed very well by TerraMetrics) with Digital Globe and other higher resolution imagery (largely post-2000 in origin) added for large parts of Europe and the US and for cities and other areas of interest across much of the rest of the world. I have added the public domain LANDSAT MSS Mosaic (circa 1975) and the LANDSAT TM Mosaic (1990) for most of the world. I am also running the LANDSAT 2000 Mosaic and adding that for parts of the world so that — as Google update their imagery — the following history will be visible : (all circa) 1975, 1990, 2000 and Google native (post 2000).

The aim is to help visualise land cover change in a simple way (alongside some of the other databases at www.kcl.ac.uk/geodata). The images have been converted to ‘natural’ colour. Invariably the data quality and resolution are reduced as we go back in time and some parts of the globe are missing for various reasons, including the degradation of data storage media at the LANDSAT stations, but nevertheless a useful simple visiualisation is possible.

But it’s not just data that Mark is serving, there is also metadata: Both the coverage area for each year and the metadata for individual tiles can be turned on, just like how professional geographers want it.

And there’s more! There is a database of place names added to the layer that manages to find ample names for even the smallest features in the middle of nowhere, linked to a Google search. This by itself is a great resource.

But perhaps the most innovative feature is the addition of a geowiki to Terrascope. Google Earth’s default imagery has the Google Earth Community layer to which people can post interesting finds. Terrascope comes with its own version of this, so that the exploration of the LANDSAT mosaics can be done socially as well.

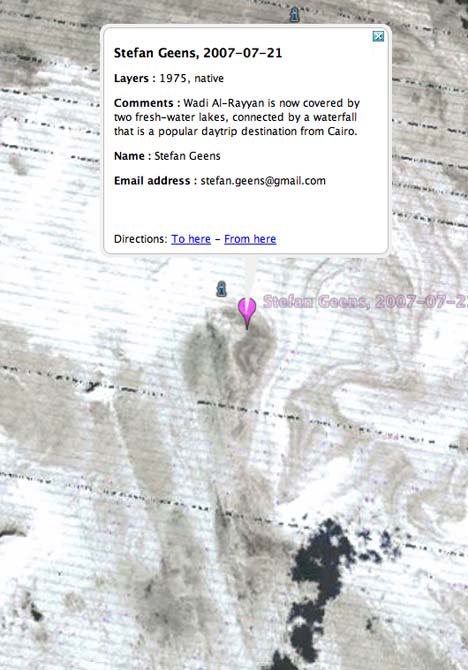
The geowiki is very easy to use. Turn it on, center a location, click on the crosshairs, get whisked to a web page, fill in the details, and refresh the wiki. Done.

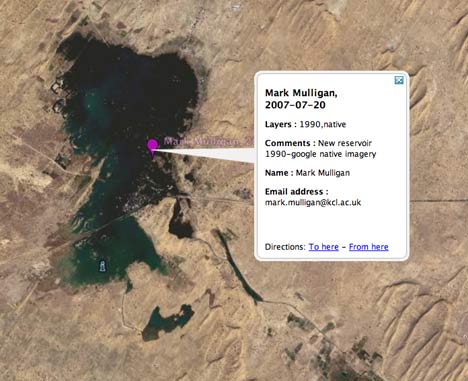
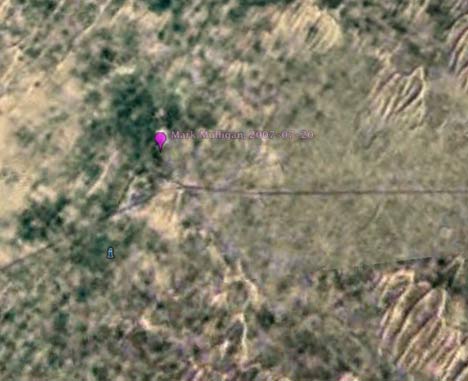
For example, Mark has pinpointed the creation of a new reservoir in Pakistan:

reservoir2006.jpg

reservoir1990.jpg

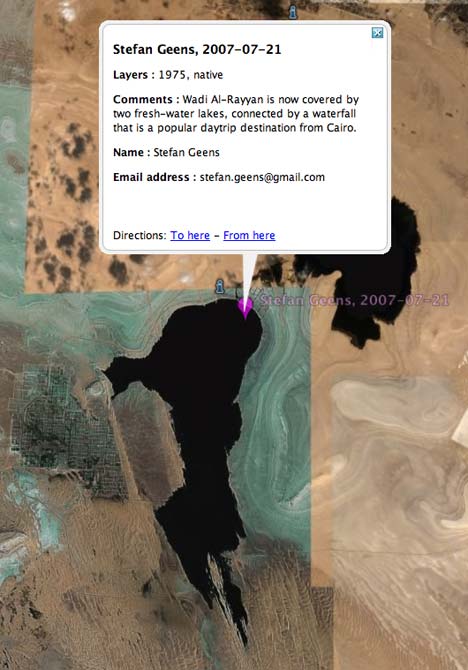
I went ahead and pinpointed the creation of two new lakes in Egypt:

egyptres2006.jpg

egyptres1975.jpg

Surfing through time as well as space is proving mighty addictive. Augmented reality meets Google Earth, and we get a glimpse of what future virtual globes will be doing natively.

KML’s <Region> + Amazon’s S3 = cheap & fast GIS

Brian Timoney writes in to Frank and I with news of a new demonstration project viewable in Google Earth. It shows various GIS resources useful in studying energy production in the US Rocky Mountains, but perhaps more important is that the layers prove the viability of serving static KML files from Amazon’s S3 service to create “passive, web-accessible storage”. The cost savings can be significant, writes Brian. He adds detailed commentary, of course:

There are a few aspects of this project that could lead to interesting points of commentary. Among them:

  • The sheer quantity of public data: over 500,000 wells spread over four states, more than 25,000 lease polygons, township/section grid, big raster layers, etc. At the last Google Developer Day Bent Hagemark mentioned that it appeared to him that the <Region> + <NetworkLink> functionality was being underutilized. Well, he can consider this “Regions gone wild”.
  • The fact that every well and every lease is linked to an online data source (for the wells, their respective states’ O & G sites; for the leases, the BLM’s LR2000 site) that has detailed drill-down information. The value-add is that each site has a different method for navigating its offerings, often in a text-driven, non-intuitive fashion. Here we have a single visual platform giving the user easy one-click access to five different online datasources. Since we’ve all been hearing about the GeoWeb meme during the recent spate of conferences, I’ll throw this out as my entry: a common, easy-to-use platform that intelligently links individual features to comprehensive data stores found elsewhere on the ‘Net.
  • We’re serving up all of the KML using Amazon’s S3 service (idea inspired by Brian Flood’s Arc2Earth product). One of the implications of the <Region>/<NetworkLink> combo is that you get all of the capability of streaming large datasets without a web server having to actively parse out the user’s Viewport parameters and then deciding what data to stream back as KML. So now, passive, web-accessible storage is quite attractive not only because of the low storage/transfer costs, but more importantly, the management overhead of a webserver dealing with live requests and database uptime, etc., etc. is no longer an issue. Server maintenance and management are huge costs in both money, but more importantly, in person-hours. The IT implications are significant.
  • “But we need database connectivity because our data is dynamic”. Really? How dynamic? Anything updated daily or less may be better written out as static KML. In our tests, it took a mere 8 minutes to write out all of the KML for 500,000+ wells from an ArcSDE database: a fairly large dataset, then, can be updated daily and reap all of the benefits of passive storage noted above. At the other end of the spectrum is a layer like Federal Land Ownership that, in a perfect world, is updated at best once a quarter. We took a snapshot directly from GeoCommunicator, tiled it up into Regions, and serve it up significantly faster than GeoCommunicator’s own web interface.
  • One of the not-subtle inferences from the above remarks is that as consultants from a GIS background, we have to face the dominance of ESRI everyday in pitching our wares. There are a plethora of methods for converting ESRI data stores to KML—ESRI’s own ArcServer technology, Arc2Earth, open source data connectors such as OGR/GDAL and Autodesk’s FDO contributions, etc. The point being, with the economics and low-hassle factor of streaming large data via KML, many organizations don’t have to make an either/or choice but rather tailor the content/visualization platform to the various needs of different end-user groups.

[…] I’ll be at FOSS4G-2007 giving both a 3-hour workshop as well as a talk on implementing on-the-fly spatial analysis with Google Earth using PHP & PostGIS.

Now if they could just fix the professional use licensing model….

Well, Brian, as for your last point: I just noticed (and confirmed) there is a promo on for Google Earth Pro right now where you can get $100 off the $400 annual subscription price: Details here. Does that help?:-)

timoney.jpg

Notice the fancy use of styles to highlight incontiguous regions.

TakItWithMe

This is shaping up like a week of useful new web applications.

EarthNC‘s free TakItWithMe, which launches today, does one useful thing really well: Turn Google MyMaps content (or even KML) into a GPX file that can be uploaded to a GPS device. If that GPS device is a Garmin and you’re running Windows, you can upload from within the web browser after installing the Garmin Communicator plugin (Mac version coming — until then upload manually using LoadMyTracks).

The KML upload feature, in beta, is useful as a way of getting other geoweb content onto a GPS device. EarthNC’s Virgil Zetterlind writes that it works with the KML feeds output by Picasa Web, Flickr, Yahoo Pipes and Platial.

The upshot: Annotate with Google MyMaps when exploring a future adventure — then easily upload those points to your GPS device and have them handy while in the field.

Paste KML into Google Maps

Chris O’Sullivan writes:

Thought you might like to know that I’ve created a quick little app that lets you view KML on a google map without having to save it to a file first. Check it out here, and details about it in my blog here.

It sure works for me — no more having to upload the KML file to a server first when wondering what it would look like in Google Maps. Just make sure to zoom in manually on the map to the region you’ve got KML for.

Links: Maptales, Cambodia, Google Earth Design

I’ve been letting these following links accumulate as I catch up on family life in a languid European summer, so here they are, belatedly, more for my own reference than anything else:

  • Maptales is a gorgeous-looking social mapping site. This field is getting crowded, but the attention to detail, the clear graphical style and the special way in which you build new content — much like georeferenced blog posts — is especially compelling. Import GPX files, publish as KML, embed on any website, and there is a dynamic drag-and-drop path editing editing tool that is bested only by Google’s own MyMaps. A mobile version is promised for later this month, though it doesn’t look like you will be able to do live updating.
  • This land is my land…: Some Cambodians were furious that the ASEAN website rounded the country’s surface area to the nearest 1,000 square kilometers — lobbing a whole 35 sq. km from the 181,035 sq. km. official tally. As a diplomatic incident brewed, ASEAN’s webmaster quickly relented. Luckily, these people haven’t noticed Google Earth’s approximated Cambodian borders. Yet.
  • iPhone does GeoRSS, KML: More confirmation: Both KML and GeoRSS links are opened in iPhone’s Google Maps app. Not sure how much complicated KML you can throw at it, but placemarks certainly seem to work. See the visual proof.
  • Good design & KML: Richard Treves has a new blog: Google Earth Design (“The Antidote to Red Dot Fever – Good Design for your Google Earth Map.”) Making a website is easy — making a nicely designed website is hard. It’s no different with KML files, and Richard is well-positioned to help, with a longstanding interest in making Google Earth maps deliver information more efficiently.
  • DIY spying: A nice sequence of Digital Globe imagery of a Chinese submarine base taken over a couple of years noting various stages of development. Makes you wish for time layers in Google Earth. I’d gladly pay for it:-)
  • German GE help: GE-hilfe.de is a German-language Google Earth tutorial and news site.
  • Taxing India: In India, the Lucknow Municipal Corporation is going to start using Google Earth to make tax assessment of properties, reports Lucknow Newsline. Why? “We were finding many difficulties in the manual assessment. The LMC did not have sufficient staff. Plus house owners are not always supportive.”
  • More KML by pros: Autodesk MapGuide Enterprise 2008 gets the ability to publish KML, reports All Points Blog. (press release)
  • iTag: Free Geography Tools reviews iTag, a free photo tagging tool for Windows that includes some geotagging options.
  • Conversion tool: ITNConv for Windows converts between a long list of popular mapping file formats, including KML.
  • Google Earth saves, cont.: Alabama Homeland Security uses Google Earth Enterprise in a manner that Google truly approves of, reports Birmingham Business Journal. (Via All Points Blog)

Nokia N95 Corner:

  • Assisted GPS explained: Ed Parsons delves into the Nokia N95’s “assisted GPS” solution that came with the latest firmware update. You may need to tweak the settings before it works for you. (Here’s how A-GPS works. And here are Nokia’s own instructions for improving the odds of getting a fix.)
  • Maploader updated: Mapperz notes a update to Nokia’s Maploader software. Maploader lets you download hundreds of megabytes of road and POI data for use by the Nokia Maps application on my phone, so it doesn’t have to go via a data network. Of course, you’ll never use most of it, it takes up lots of room, and it only gets updated twice a year (and only then if you do so manually), but this is great if you’re going to be travelling through hostile data networks:-). (Via Downloadsquad)

Mobile GMaps update (and a look at personal location publishing )

Over the past few weeks, the mobile mapping application I use most on my Nokia N95 — the excellent and free Mobile GMaps (for Symbian S60) — has gotten a slew of updates that together make for a significantly better user experience. It’s worth the download, especially now that the N95’s slow GPS location fixing has been improved with the latest firmware upgrade.

My favorite new feature is that I can now show my last published location via a simple URL using GMap-Track: here it is. Whenever I use Mobile GMaps, that URL gets updated with my live location every 30 seconds. As of this writing, you’ll see me near Antwerp. From now on, if you ever need to know where I’ve arrived recently, you can check my location via Ogle Earth’s about blurb, on the top right of the index page.

gmaptrack2.jpg

The other major improvement is that map tiles are now cached — this greatly improves speed and cost, especially when roaming, because you can use GMaps without connecting to a data network (if you’ve downloaded the data before, obviously).

Then there is smaller stuff that all adds up: better speed and direction overlays, landscape mode, access to OpenStreetMap tiles, traffic congestion info (in the US)… The one thing it doesn’t do is save tracks — but for that I use a separate Garmin GPS receiver anyway, or I could use Nokia’s own Sports Tracker software. As far as I am concerned, it’s the ability to broadcast my location live that is the real killer component to Mobile GMaps — and then to get information back based on that, automatically.

DSC_0003.jpg

One feature I haven’t explored much: You can use Mobile GMaps to track other people who are also using the application, live (with their permission). I just don’t know enough people with smartphones:-)

What could improve on this? An API is in the works, so that presumably I will soon be able to query my (or a friend’s) location programatically and send myself an SMS if somebody or something is nearby, or else add a small map of my most recent location to a web page, or have a KML network link show where I am. Some of this stuff is being worked on elsewhere, but not all the pieces are in place yet: With Plazes you currently have to update your locations manually; Twittervision does have an API, and you can update your position automatically when you twitter using Twibble on the N95, but as far as I know there is not yet a ready way to convert that location information into an embedded personal map (or mapplet, for that matter).

There are so many conceivable ways in which a person’s location might be revealed online. One relatively easy solution, using existing standards, would be to publish each new location as a new entry in a personal GeoRSS feed. Collect such feeds of friends to keep track of them, just as if they were blogs:-). Just right now, the Twitter API supports RSS but not GeoRSS for output by individual users. Location-enhanced GeoRSS Twitter feeds would make all manner of mashups possible, not least via Yahoo’s Pipes and Google’s Mapplets. And if Google Mapplets become viewable on the Nokia N95 (or a future GPS-enabled iPhone), then all kinds of wonderful feedback loops will suddenly be possible.

New imagery of Iran’s nuclear project now on Google Earth

A Washington Post article alerted me to a new report on Iran by the Institute for Science and International Security, released as a PDF on July 9, 2007. The report shows new tunneling activity near the Natanz nuclear complex on imagery taken by a Digital Globe satellites on June 11, 2007.

It’s great that ISIS is buying brand-new Digital Globe imagery to rush us third-party independent analysis of the continuing nuclear brouhaha in Iran. Last year, a report by ISIS showed new tunneling near another Iranian nuclear complex, near Isfahan. Just like last year, however, this imagery has been made available online in a PDF and not as an overlay on Google Earth. A KML overlay is far more useful, as you can compare before-and-after views yourself:

afternatanz.jpg

New roads leading into the mountains south of the Natanz nuclear facility.

beforenatanz.jpg

Current Digital Globe imagery in Google Earth, without the overlay.

Here, then, is the June 11 2007 imagery as an overlay. (And here is last year’s overlay; download them both for a remarkably good overview of Iran’s nuclear project. Current imagery in Google Earth of the Natanz site itself is more recent than that of last year’s overlay, adding yet another step in the chronology.)

Notes on the political, social and scientific impact of networked digital maps and geospatial imagery, with a special focus on Google Earth.