- GPicSync is a Google Code project for syncing GPS devices with the EXIF location metadata of photos, with the option of creating a KMZ version for Google Earth. PC and Linux.
- Erstwhile UK Ordnance Survey CTO Ed Parsons starts working at Google as Geospatial Technologist for EMEA (Europe, Middle East and Africa). Sounds like a dream job! On the occasion, everybody gets to make a wish: James Free asks him to make Google Earth free for business use, Christian Spanring wants him to lead the convergence between GIS and neogeography, and I’ll ask him to sync Cairo’s road data with the satellite imagery:-)
- Google Earth Hacks is going multilingual, with a Spanish language version, and more languages promised.
- Now Thailand bans YouTube because some users uploaded caricatures of He Who Must Not Be Mocked, the Thai king. YouTube tries to comply by removing the offending content, but new stuff seems to keep on popping up. Once again, diverging standards of free speech clash, with the most restrictive winning out and becoming the universal standard. If censorship of this kind must be practiced in order for Thailand to remain a business proposition to Google, then I would much prefer it that only Thai IP addresses suffer the consequences of their sovereign choices. Once again, this is a precedent with implications for Google Earth Community.
Drawing in Google Maps vs drawing in Live Local: Which is better?
Two weeks ago, Google added the ability to subscribe to GeoRSS in Google Maps. A few days ago, Microsoft updated its Live Local mapping tool, adding the ability to publish your placemark collection as GeoRSS. Other improvements included enhanced drawing tools, but also a wholly underwhelming ability to see Virtual Earth 3D in Windows versions of Firefox (once again missing the entire point of using a web browser for delivering content).
And now, this morning, Google has updated its Maps product yet again, adding “My Maps”, user-generated collections of annotated placemarks, lines, and polygons. This is something of a catch-up maneuver for Google, or, more kindly, a change of tack: Until now, Google was happy to let third party developers use the Google Maps API to produce such services. Now it seems that Live Local/Live Search/Virtual Earth’s collections feature (available since May 2006) has goaded Google into offering a similar default functionality.

This sets the stage for a comparison, of course. I tried out both services this morning while in a bad mood — the best mood for reviews.
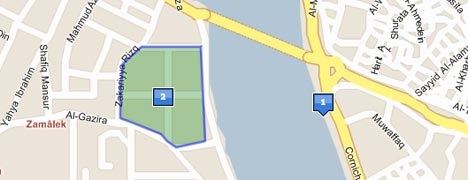
I decided to put some objects here in Cairo on the map. Using Google Maps to do this is very simple. Choose “Create new map” and several new icons appear on the map — for creating a placemark, a line and a polygon.
Zooming in on Cairo in Hybrid mode, we had a problem: Use the roadmap of Cairo, or the satellite imagery? Which one will be accurate in Google Earth? They’re misaligned by about 100 meters, so I decided to put a placemark in both possible spots, and then drew a line between them. Alas, the line didn’t tell me how long it was, so I couldn’t accurately measure the offset.

None of this detracts from the fact that these new drawing tools are very easy to use. Editing is a cinch: Just drag a placemark to a new spot — you’ll find yourself doing it over and over again just to marvel at the lovely animations. Individual polygon points are also draggable, with plenty of visual feedback while you do so.
How does Microsoft Live Local stack up against this? Drawing the same content in hybrid mode for Cairo was a nonstarter — there is no high resolution imagery of Cairo, so no opportunity to misalign it. Using just the roadmap, then, I found the tools to be practically on par with Google Maps in terms of functionality.
Some differences: In Google Maps, editing existing content is more intuitive — just drag a placemark, or right-click on an object for editing options. In Live Local you first need to find the item on your scratch pad. Unlike Google Maps, Live Local does measure distance and area automatically for lines and polygons — but in acres and yards, which is great if you’re Shakespeare. I looked everywhere for the option to use metric units, to no avail. Finally, when it comes to editing the contents of the popup window, Google Maps has more options — you can choose between plain text, rich text and full HTML, which includes the ability to embed YouTube videos and such.
Surprisingly, perhaps, neither service offers the ability to embed your map on your site or in a blog post, especially as the API makes it possible. Tagzania lets you embed your placemark maps — and, by the way, has published placemarks as GeoRSS for ages. Here’s proof, using Google Maps’ ability to read GeoRSS.
Live Local and Google Maps (and Tagzania) give you a permalink to your map. While Live Local will let you see your content in the browser using Virtual Earth 3D (but only on PCs), Google Maps (and Tagzania) offer a link to the map in Google Earth. How does that measure up? There are still some conversion problems for Google: In Google Maps, X marks the spot where the icon hits the ground. In Google Earth, X is at the middle of the icon. The result is that placemark icons are off-center in Google Earth, like so:
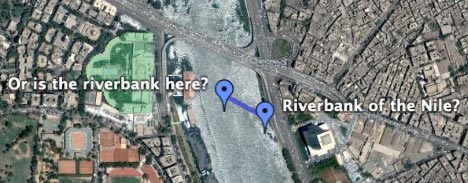
(In case you’re wondering, the satellite imagery in Google Maps aligns with the imagery in Google Earth. Google Earth doesn’t yet have road data for Cairo.)
So, the verdict: I will continue to use Tagzania for annotating places, especially as it uses tags to organize your “collections” and publishes them as both GeoRSS and KML. But tags are still something for the Web 2.0 crowd, not my parents, and Tagzania doesn’t do polygons and lines or embedded videos, so for this sort of project I’d recommend Google Maps over Live Local — mainly because the editing of existing content is more intuitive, and because you can stuff more stuff more easily into the popups.
(One more thing: Also added today in Google Maps: The search tool returns georeferenced content found in indexed KML files, just as has been possible in Google Earth for a month or so now.)
Links: Unype 0.2, Google Earth Library, iPhotoToGoogleEarth 1.03
- Skype-based Google Earth controller Unype reaches version 0.2, gaining some significant new features, as explained on the app’s blog: You can now show an avatar of your choosing at your location, see others’ avatars, share models, and synchronize layer visibility settings with other users. This latter feature is great, because it in effect gives Google Earth shared states, much as in online multi-user networked games and Second Life. Oh, and you can of course still direct the view of others remotely, or follow along with another’s explorations.
It’s Windows only, but that’s because the API of the Windows client is so much more sophisticated. Slowly but surely, Google Earth is turning into a MMORPG. Impressive.
- There’s a new Google Earth blog on the block — and this one truly looks promising: Google Earth Library focuses on finding and cataloguing KML content for Google Earth (as opposed to highlighting landmarks or views in the base layer, something which many sites already vie to do). Much of what’s on offer looks useful for education, so especially educators should take a look.
- Mac app iPhotoToGoogleEarth reaches version 1.03, and now its author, Craig Stanton, is off for six months hiking the entire Pacific Crest Tail. He’s geoblogging the trip, and is doing so using one of the most seamless implementations of Google Maps and blogs I’ve seen to date. There is a KML network link to subscribe to as well.
- MIT Technology Review reports on a new computer model made by Ohio State University for determining the probability of traffic accidents in different times and places — with the results shows as KML in Google Earth:
- Matthew Hurst at Data Mining has the list of all the universities taking part in Google’s 3D campus competition — that he knows of.
Google comments on the New Orleans imagery brouhaha
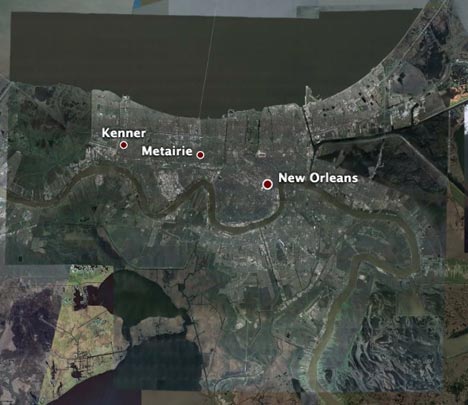
First this morning came the update to post-Katrina imagery for New Orleans in Google Maps and Earth’s base layer, and now an explanatory blog post by Google Earth general manager John Hanke. In it he confirms:
- The post-Katrina imagery was removed from the base layer way back in September 2006, and nobody noticed until now.
- The post-Katrina imagery has remained available since then via several network links downloadable from this site, for example this network link.
- The new updated imagery of New Orleans is from 2006 and its publication was expedited after the outcry over the past few days.
The new imagery comes with no credit/sourcing, so it’s not clear whose it is.
New Orleans, take two
if you check out New Orleans this morning, you will now see distinctive blue tarpaulins on rooftops, construction in progress along the dykes, and a city that — from the air, at least — looks like it is springing back determinedly from Katrina.
In other words, Google Earth has just updated its imagery for New Orleans following a hue and cry after it became widely noticed that the existing imagery in the default layer was from before hurricane Katrina.
Giving people what they want is obviously the best way to defuse PR “crises” such as these:-)
3D charting: Google Earth or Second Life?
Adam Schneider, who is behind the GPS Visualizer web app, has been experimenting with ways of using Google Earth to visualize non-geospatial data. He writes:

I wanted to create a graph of some data that has FOUR dimensions, so I did it in Google Earth.
The data in question is a list — that someone else compiled — of discs used in the sport of disc golf; the four dimensions are:
- “High-Speed Stability” (how much a disc resists turning to the right when thrown with a lot of speed)
- “Low-Speed Stability” (how hard a disc tries to fade left as it slows down)
- “Range” (how far the disc can be thrown)
- “Power Requirement” (how strong of an arm you need to get the disc to do what it’s intended to do)
I used Excel to translate HSS and LSS to latitude and longitude (in the middle of the Pacific Ocean!), used absolute altitude to represent the Power Requirement, and then used GPS Visualizer to colorize the points by Range. Then I created a set of axes in Illustrator and added it as an image overlay.
I suppose if one wanted a FIFTH dimension, you could use time. (If I had translated Power Requirement to time instead of altitude, you could use the timeline to quickly filter out discs on either end of the scale.)
And, it just occurred to me, you could resize the points for a sixth dimension.Now that’s getting to be a bit much. :)
KML’s ability to describe and reference objects in three dimensions clearly lends itself to data visualization experiments of this kind. But so does the Second Life client — IBM has developed some cool examples on its islands, as documented on their Second Life developers’ blog:
So what are the advantages and disadvantages of each? These are the ones I came up with while enjoying free wifi at Budapest airport:
Advantages of Second Life: The client is free to use, even for business. Objects can be scripted, so they can be made to interact with each other, or rearranged according to user inputs. 3D charts can also be viewed and commented on communally inside the application — and you can also point out interesting elements by physically going to the datapoint in questions and flagging it; others will see you do it.
Advantages for Google Earth: You can publish your chart as KML for free — in Second Life, you need to buy or rent property before you get the ability to build on it, and even then the rules may be restrictive. (You can practice in a “sand box” in Second Life, but nothing there is permanent, so you can’t direct people to it via a permalink.) A KML/KMZ 3D chart object is also easily portable, in that it is a file which you can email. In Second Life, by contrast, objects exist in-world only, on Linden Lab’s servers, so you have to direct people there via a URL (“slurl”).
When it comes to static data objects,, you currently have to build these manually in Second Life — whereas it is relatively straightforward to convert a spreadsheet of data into KML via XSLT, as EditGrid does, because you’re mainly doing text manipulation. Nothing equivalent exists for Second Life at the moment.
When it comes to dynamic data updates, both applications lets you use information on the web to update chart objects: In Google Earth, it’s doable via a network link, though then the conversion to KML has to be done server-side, while in Second Life, URLs can be called from within the scripting language and then massaged accordingly. In both cases, you need to write the data manipulation code beforehand and serve it from your own server (in Google Earth) or via objects on your own property (in Second Life).
Both applications will continue to improve, and may start adopting some of each other’s features, but there are also other applications being developed that may be aimed more specifically at 3D visualizations for business, such as Ogoglio. So this is a very interesting space to watch.
(Interestingly, Second Life has also seen a weather visualization experiment — taking advantage of SL’s scripting abilities to convert coordinate data into SL’s Cartesian coordinate system.)
Links: HoudahGeo, EarthNC Plus, Google GeoDay report
- I’m in Budapest for the weekend so I can’t really give this the attention it deserves, but HoudahGeo (beta) is a new photo georeferencing software app for the Mac, and at first glance it looks really gorgeous and easy to use, with Google Maps and Earth integration. I will test this on my photographer-dad tomorrow while in Belgium and report back. (Via tuaw.com)
- Google Earth Blog has details on the release of EarthNC Plus, US National Oceanic and Atmospheric Administration (NOAA) marine charts turned into KML files on CD, produced by DestinSharks.
- Google Blogoscoped has a report about Google GeoDay in the Netherlands.