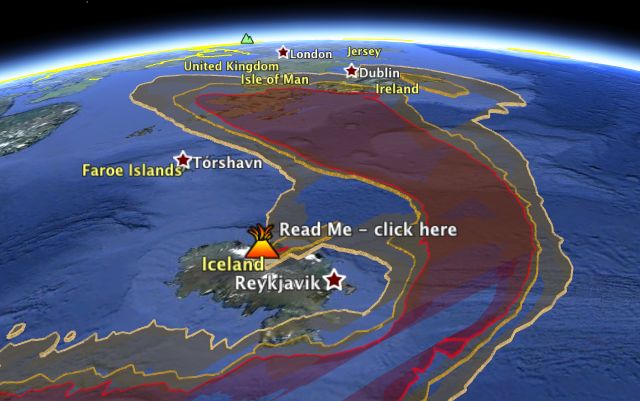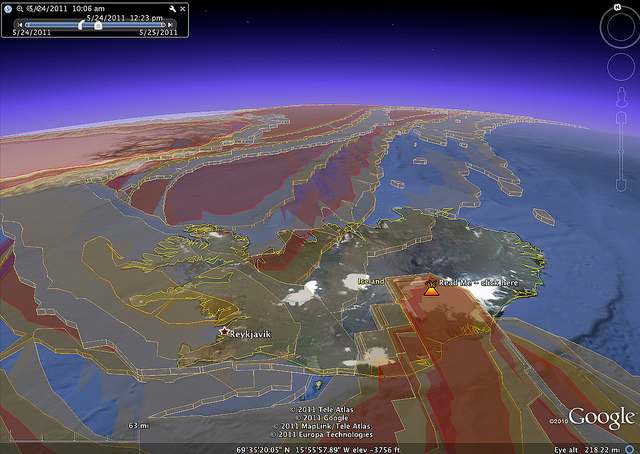
With erupting Icelandic volcanoes seemingly becoming an annual event, Adam Burt has overhauled his ash-cloud visualization tool for Google Earth, which he first made for Eyjafjallajökull’s eruption in June of 2010. Based on data gleaned every six hours from the UK Met office, the resulting network link visualizes ash density from Grimsvötn at different times and airspace heights, and can be played as an animation. Here it is — open in Google Earth.

Interesting to see how at different heights, the ash heads off in completely different directions.
Just to say that Met Office have now paused their CSV updates of Grímsvötn but the good news is that I’ve got my KML archive file from the 23rd of May to 29th available to view at:
http://homepage.mac.com/a.burt/downloads/Grimsvotn_archive.kml.zip