Mobile GMaps update (and a look at personal location publishing )

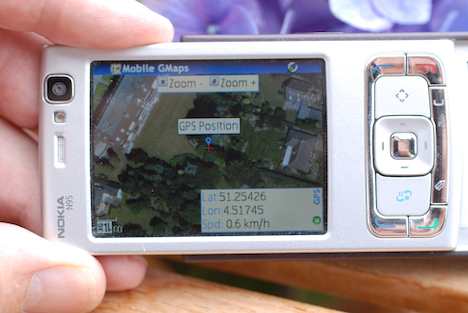
Over the past few weeks, the mobile mapping application I use most on my Nokia N95 — the excellent and free Mobile GMaps (for Symbian S60) — has gotten a slew of updates that together make for a significantly better user experience. It’s worth the download, especially now that the N95’s slow GPS location fixing has been improved with the latest firmware upgrade.

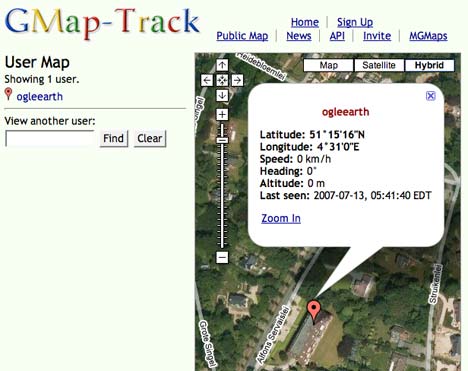
My favorite new feature is that I can now show my last published location via a simple URL using GMap-Track: here it is. Whenever I use Mobile GMaps, that URL gets updated with my live location every 30 seconds. As of this writing, you’ll see me near Antwerp. From now on, if you ever need to know where I’ve arrived recently, you can check my location via Ogle Earth’s about blurb, on the top right of the index page.

gmaptrack2.jpg

The other major improvement is that map tiles are now cached — this greatly improves speed and cost, especially when roaming, because you can use GMaps without connecting to a data network (if you’ve downloaded the data before, obviously).

Then there is smaller stuff that all adds up: better speed and direction overlays, landscape mode, access to OpenStreetMap tiles, traffic congestion info (in the US)… The one thing it doesn’t do is save tracks — but for that I use a separate Garmin GPS receiver anyway, or I could use Nokia’s own Sports Tracker software. As far as I am concerned, it’s the ability to broadcast my location live that is the real killer component to Mobile GMaps — and then to get information back based on that, automatically.

DSC_0003.jpg

One feature I haven’t explored much: You can use Mobile GMaps to track other people who are also using the application, live (with their permission). I just don’t know enough people with smartphones:-)

What could improve on this? An API is in the works, so that presumably I will soon be able to query my (or a friend’s) location programatically and send myself an SMS if somebody or something is nearby, or else add a small map of my most recent location to a web page, or have a KML network link show where I am. Some of this stuff is being worked on elsewhere, but not all the pieces are in place yet: With Plazes you currently have to update your locations manually; Twittervision does have an API, and you can update your position automatically when you twitter using Twibble on the N95, but as far as I know there is not yet a ready way to convert that location information into an embedded personal map (or mapplet, for that matter).

There are so many conceivable ways in which a person’s location might be revealed online. One relatively easy solution, using existing standards, would be to publish each new location as a new entry in a personal GeoRSS feed. Collect such feeds of friends to keep track of them, just as if they were blogs:-). Just right now, the Twitter API supports RSS but not GeoRSS for output by individual users. Location-enhanced GeoRSS Twitter feeds would make all manner of mashups possible, not least via Yahoo’s Pipes and Google’s Mapplets. And if Google Mapplets become viewable on the Nokia N95 (or a future GPS-enabled iPhone), then all kinds of wonderful feedback loops will suddenly be possible.

New imagery of Iran’s nuclear project now on Google Earth

A Washington Post article alerted me to a new report on Iran by the Institute for Science and International Security, released as a PDF on July 9, 2007. The report shows new tunneling activity near the Natanz nuclear complex on imagery taken by a Digital Globe satellites on June 11, 2007.

It’s great that ISIS is buying brand-new Digital Globe imagery to rush us third-party independent analysis of the continuing nuclear brouhaha in Iran. Last year, a report by ISIS showed new tunneling near another Iranian nuclear complex, near Isfahan. Just like last year, however, this imagery has been made available online in a PDF and not as an overlay on Google Earth. A KML overlay is far more useful, as you can compare before-and-after views yourself:

afternatanz.jpg

New roads leading into the mountains south of the Natanz nuclear facility.

beforenatanz.jpg

Current Digital Globe imagery in Google Earth, without the overlay.

Here, then, is the June 11 2007 imagery as an overlay. (And here is last year’s overlay; download them both for a remarkably good overview of Iran’s nuclear project. Current imagery in Google Earth of the Natanz site itself is more recent than that of last year’s overlay, adding yet another step in the chronology.)

Links: Minimap, R, Hanke interview, GeoXtract

  • Minimap sidebar for Firefox:

    The Minimap add-on gives you a suite of in-built maps and mapping tools for your web browser. Create and save a sidebar map using the addresses or address links you find on web pages (highlight then drag and drop), or by manually adding locations. View traffic Info, drag and drop kml files, local search, Google, Yahoo and Live Local directions, view in google earth, tagzania, platial, geourl and many more. Address/Location points are stored locally for later use.

    It’s remarkable how sophisticated web mapping tools have become over the past two years.

  • R for geospatial analysis: Screenshots showing visualization of spatial data analysis using the statistics tool R and its maptools package, which can export to KML.
  • Hanke interview: Datamation has an interview with John Hanke. A teaser:

    People can have community sites about specific topics and, with this phenomenon of the long tail, you can have people aggregating around their specific interests and doing annotations around that and sharing them. And if [Google Earth] is going to be viewed as a single map, you need to have a standard so you can search and browse it. Otherwise it’s just a bunch of siloed information. [Hence KML => OGC]

  • New geocoding app: I don’t know how I’ve missed it until now, but GeoXtract by Terra IMS is a standalone Windows geocoding application that takes spreadsheet data and outputs it as a Google Map or KML — to your own website, hosted on GeoXtract.com or to your local hard drive. Here is a gallery of examples. The basic version is free, and Mac support is promised. Very cute Web 2.0 site design to boot. (Via AnyGeo)
  • Nokia N95 mashup? Set your Nokia to take time-lapse photography or video, attach it with duct tape to a kite, and voila, the easiest DIY aerial imagery yet. Until the landing, that is.
  • Multitouch history: Because next year everyone will be surfing Google Earth using multitouch on our iPhone, here’s a overview of the history of multitouch systems by one of the early innovators.
  • KML on iPhone? One blogger and iPhone owner reports being able to load a KML file published to the web in Google Maps on iPhone. Can anyone replicate that feat? By dint of a geographical misfortune, I’m cruelly deprived of iPhones here in Sweden.
  • GPS with Java: Are you a Java developer? Check out gpsdings 0.2, a Java command line tool for extracting GPS data from a GPS receiver.
  • How do you spell relief? Microsoft Virtual Earth 2D maps get shaded relief, reports the Map Room. With hindsight, that’s an obvious improvement for a mapping service, and it looks great.
  • Michael Jones article: Google Earth Blog points to a paper by Google Earth CTO Michael Jones outlining some of the big-picture thinking that’s going on at Google regarding the (geospatial) organization of the world’s information.
  • Dresden in 3D: Google Earth Blog also flags the news that Dresden is now available as a network link of 3D buildings.
  • TITAN does KML: Leica TITAN now “supports the direct publishing and serving of geospatial data to Google Earth,” says an email to registered users, as All Points Blog notes.

King’s College London releases treasure trove of geographic KML

Mark Mulligan, Reader in Geography at King’s College London, has been gathering an incredible collection of KML geography layers, but until recently did not have the server resources to make them public. That’s changed, so here they are, below.

I’ve only had a limited time to play with them, but what’s obvious is that these layers are highly detailed, thorough and labyrinthine. Check out the Amazon layer, for example: There is visualized information available both at the regional level and at specific hyperlocal places (with some highly detailed aerial photography).

Geographers and university geography departments should take a close look at this collection, as there is sure to be plenty of material here that is useful for their own projects. Perhaps other geography departments could follow Mark Mulligan’s lead and publish their own geographic resources — to help inform the public on the current climate change debate, but also to enthuse future generations of geographers…

Here is Mark’s outline of the available layers

These are public domain environmental data aimed at improving the information (raw and visualised) available to the scientific and conservation communities. The data are freely accessible to all for non-commercial use. Some of the data have been on a slow server for more than 18 months but I have been unable to publicise them until I improved the server capacity, which I have now done. Many of the datasets are works in progress and comments or contributions are welcome. The data are visualised in Google Earth and, in many cases, links to the actual downloadable GIS files also provided. Region based network links are used so zoom in to see the information. I list the main ones here with the ones most relevant to the user community listed first. Another couple of very large ones will become available within the month. All can be accessed through this list (where future databases will also be added) but each also has a shortcut URL as indicated below:

The data are held at King’s College London, Department of Geography:

www.ambiotek.com/places [online] – 5 million geographic features (places etc from the GNS, editable with ‘geowiki’)

www.ambiotek.com/landandwater [online] – 30m resolution outlines of coasts and water bodies from the shuttle radar topography mission

www.ambiotek.com/sealevel [online] – 90m resolution near global analysis of coastal indundation (sea-level rise) scenarios under different levels of sea level change, based on the SRTM data

www.ambiotek.com/seasons – [online] animation from the MODIS blue marble new generation at full resolution (500m pixels) – showing the impact on vegetation and snow of the passage of seasons over the earth and more or less cloudless colour consistent imagery

www.ambiotek.com/topoview (collaborative with the CGIAR) [online] – 90 m hole filled shuttle radar topography data and visual overlays

www.ambiotek.com/paa (collaborative with NASA JPL) [online] – the protected area archive – historic (1972-2007) false colour satel;lite imagery for global protected areas (natural colour version online by end of july)

www.ambiotek.com/amazon (collaborative with INPA) [online, growing] – a pan amazon database including annually updated landsat imagery for looking at land use change and other environemental issues affecting the Amazon

www.ambiotek.com/1kmrainfall [online] – a 1km rainfall climatology including monthly and annual totals, intensities and derivatives Based on data from the tropical rainfall monitoring mission

www.ambiotek.com/rainfalltimeseries [online] – near global 3 hourly rainfall data since 1998 at 0.25 degree spatial resolution including trend analysis (drying, wetting) and seasonality analysis, based on TRMM/GOES data

www.ambiotek.com/cloudforests [online] – tropical montane cloud forests distribution and threats

www.ambiotek.com/fiesta [online] – hydrology and climate of central america

www.ambiotek.com/tbs [online] – very high resolution (sub centimeter) aerial photography and other data for a unique lowland amazon rainforest research site

www.ambiotek.com/oriente [online] – oil related activity in the (western) Amazon

www.ambiotek.com/trees [online] – near global tree cover and tree cover change 2000-2005 based on MODIS VCF product

You can reach Mark Mulligan via this page.

Global Cities at the Tate Modern

I’m in London for the weekend to see the niece. This morning we went to the Tate Modern’s Global Cities exhibit — a social geographer’s dream and a wonderful place for toddlers to explore. It’s a bit like Google Earth unplugged: population density maps you can climb, and big glorious imagery of cityscapes on the walls. Worth a visit if you are in town (until August 27). Some pics below, but here’s the whole set on Flickr.

20070708042.jpg

20070708039.jpg

Bahrain’s Google Earth ban, one year on…

In Bahrain, the government of Sheikh Khalifa bin Salman al-Khalifa for a time blocked Google Earth back in 2006 so you couldn’t see how big his and his cronies’ palaces were in a country with a chronic housing shortage. He has now just received a Scroll of Honour award from the UN’s Human Settlements Programme. What does that award recognize?

Its aim is to acknowledge initiatives which have made outstanding contributions in various fields such as shelter provision, highlighting the plight of the homeless, leadership in post conflict reconstruction, and developing and improving the human settlements and the quality of urban life.

You can’t make this stuff up. (Via …Or Does it Explode?)

Russia gets (Google) maps

Maps.google.ru goes live. The Moscow Times (a wonderful paper where I once had the pleasure of interning) has the backstory:

gmapsru.jpg

When Google Earth was launched in 2005, Russia was just one of many countries to warn that making so many geographical details available to the public represented a real security risk.

A Federal Security Service general said that this would mean terrorists would no longer need to reconnoiter their targets. “Now a U.S. company will do the work for them,” Lieutenant General Leonid Sazhin said.

In what analysts say is a sign of the times, however, the government issued a directive in May that effectively lifted all of the old restrictions on access to “precise geographical data.”

Great to see Russia coming round to the enlightened view. I hope India’s government takes the cue and goes next in lifting these outdated restrictions.