Earlier today I asked ISIS if I could overlay in Google Earth the high-resolution original of the GeoEye image taken on September 26 showing what is likely the underground nuclear fuel processing plant being built near Qum in Iran. Soon after, my inbox brimmed not just with the original image file from September 26, but also with the DigitalGlobe image from January 2009. (See previous Ogle Earth story for context.)
The September 26 GeoEye image is a massive 6,000×6,000 pixel tile covering 9 square kilometers at 50cm per pixel. The January 2009 DigitalGlobe image clocks in at almost 4,000×4,000 pixels and 60cm per pixel. They’ve now been overlaid in Google Earth and are available as a 11MB KMZ file.
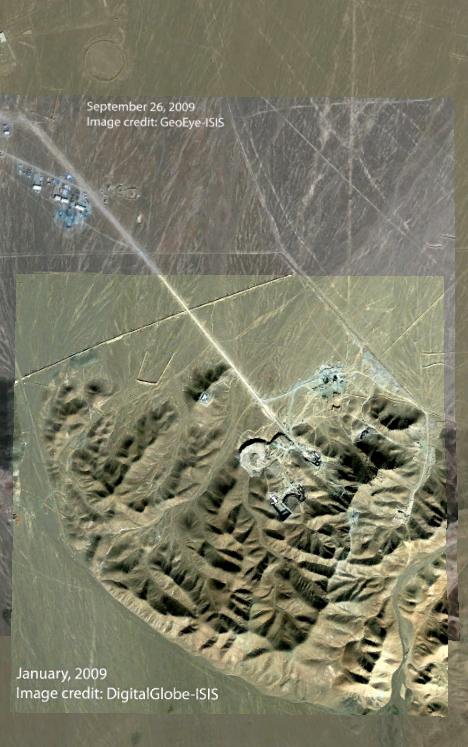
The images haven’t been orthorectified, so I’ve aligned them as much as possible on the flat features of the plain. This means that higher ground diverges between the two images and Google Earth’s base image (from March 25, 2005).
With these original-resolution versions, there is much delicious detail to explore — vents, depots, trails, towers, and a whole new hamlet to boot. Go crazy:-) (Remember, the opacity slider in the sidebar is your friend. Select the layer in the sidebar, and start sliding.)
Perhaps this is also a good moment to step back in awe at what modern technology has wrought — the ability for any sufficiently concerned citizen or organization to scrutinize any desired spot on Earth within hours of making the request, and then being able to publish the result to a context-rich virtual globe that is universally available. That’s a profound shift in favor of accountability, transparency and democracy. Monitoring the planet has been crowdsourced.
Case in point: In response to my throw-away line in the last post about how “intelligence services are right now trying to calculate the volume of the excavated mound … to estimate the minimum size of the excavated space”, “Blowback” pointed me to a comment thread on the very public Arms Control Wonk site where this calculation has already been tackled. Blowback’s own contribution is resplendent with the kind of geeky detail that I can only marvel at, so here it is in full, with permission:
Looking at the early spoil heap (2005), the area of the top is ~9,500 sqm while the area of the bottom is ~14,500 sqm. Assuming a 45deg slope, the maximum depth (at northern tip) is ~14m while the minimum depth (southern edge) is 4m. Simplifying this gives an average area of 12,000 sqm and a average depth of 9m so the volume of the early spoil heap is ~110,000 cubic metres. I would guess that the new pile is about 4 times the early pile, so the total volume would be 550,000 cubic metres. With your expansion factor of 1.4, that means the tunnel volume is ~400,000 cubic metres. For reference, the two huts are about 1000 sqm each.
It is most likely that the underground structure consists of a roadway and a large chamber(s). If we assume that the first excavation was a roadway to reach the chamber and they were using say Terex TA40 articulated tippers, then the roadway would need to be 6m high by 10m wide giving a spoil volume of 60 cubic metres per linear metre, so the spoil volume of 110,000 which equates to a solid rock volume of 78,000 cubic metres translates to a roadway length of 1300 metres. As for the chamber, the volume of spoil is ~440,000 cubic metres which would result from ~320,000 cubic metres of solid rock. So at a height of 6m, this would give a floor area of over 50,000 sqm. Quite big!
Blowback, who has a civil engineering background, explains some of his assumptions:
The expansion factor is to allow for the increase in volume that occurs when you dig rock out of the ground. The size of the roadway is determined by twice the size of the tipper truck used to haul muck out of the tunnel – you want two trucks to be able to pass each other at any point in the tunnel otherwise you radically slow the tunnelling rate. I picked the Terax TA40 because that is typical of the tipper trucks used in driving roadways in tunnelling – too small a truck and it takes too long, too large a truck and you have to haul too much muck. There is a lot of estimation in my rough calculations but the results are probably right in terms of order of magnitude so when I say the access tunnel length is 1300 metres, then the probability that it is between 1 and 2 km is high, but it is pretty unlikely to be 10kms and very unlikely to be 20kms. If you spot any mistakes in my calculations, please let me know.
How did I ever survive before the Internet?
DEar Sir/Madam. Could you please contact me – I am looking to find the best resolution images that I can obtain of a section of the Kaladan River in India where my uncle crashed his RAF Spitfire Reconnaissance aircraft in 1943 (ie. in WWII when flying with the British Royal Air Force). Neither his remins nor the aircraft were recovered as there was enemy action too close for the recovery to be effected by allied forces in the area. I am investigatng whether the crash site can be identified against available satellite imagery. To date my knowledge in this area is very limite and I wondered if I could be put in touch with someone who is more knowledgable with maps/images etc. so that I might get better resolution images than I am presently getting using Google Earth. Many thanks. Sincerely . Michael Hain